Top European sovereign bond funds
Introduction
As we approach 2025, inflation is easing and central banks are beginning to lower their rates. However, the American economy, less dynamic than before, could suffer an additional shock with the return of an “America First” policy likely to fuel a new wave of inflation. Such a gust could topple the “house of cards” of high valuations in the American equity market, plunging investors into an unprecedented crisis.
Faced with these uncertainties, “European Sovereign Bond Funds” are regaining their historical appeal as safe havens. In the past, these bonds have often served as “fly to quality” assets, protecting portfolios during periods of turbulence, while offering welcome diversification from equity risk. Today, the widening of French OAT spreads compared to German bonds further enhances the return potential of this protection. Moreover, geographic diversification across different eurozone issuers (Germany, Italy, Spain, etc.) strengthens the robustness of bond allocations and their ability to absorb a potential macroeconomic shock.
With nearly 1,200 funds available, including 180 eligible for life insurance and PER contracts in France, selecting the right vehicles remains essential. The tool offered by EnvestBoard facilitates this work, allowing you to compare both active and passive funds, and to evaluate not only their resilience during unfavorable periods but also their ability to seize opportunities when conditions improve.
In this analysis, we will study a selection of Top European Sovereign funds in EUR, compared against a benchmark tracker.
We will analyze their behavior over 3 years, in a difficult environment, then over 1 year, in a more favorable one, to illustrate their ability to combine defense, return and diversification. The objective: to provide concrete benchmarks for building a suitable allocation, combining structural robustness, responsiveness and capital preservation.
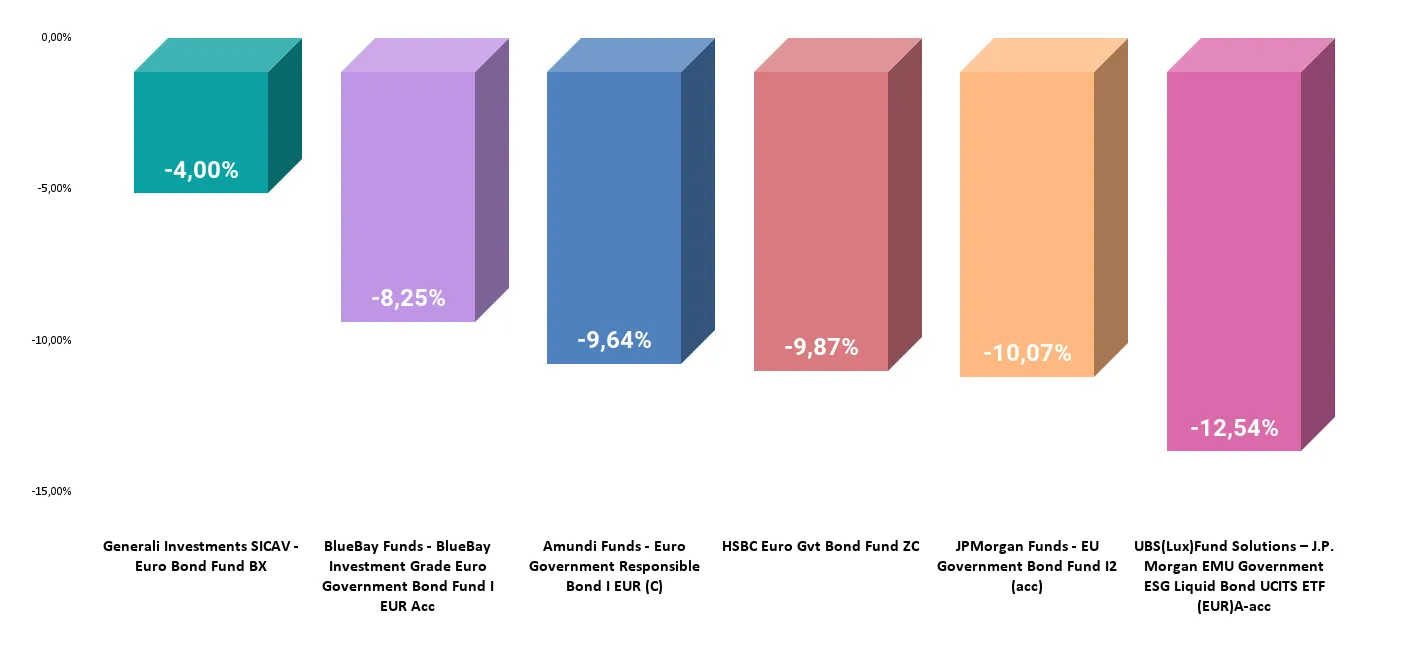
Unfavorable scenario: rising rates
Performance over 3 years (from 07/12/2021 to 06/12/2024)
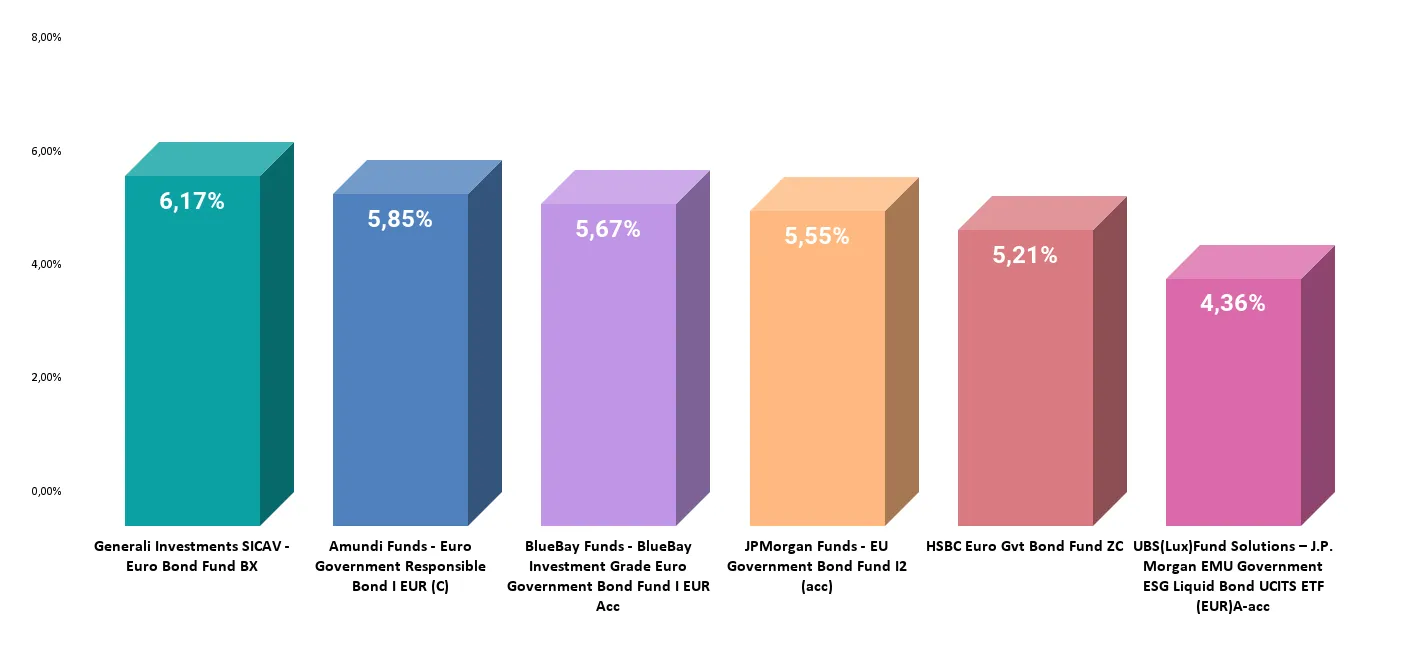
Favorable scenario: falling rates
Performance over 1 year (from 07/12/2023 to 06/12/2024)
Funds in detail
1. Generali Investments SICAV – Euro Bond – BX
Fund Inception Date: April 2, 2002.
Investment strategy: The fund aims to outperform the J.P. Morgan EMU Government All Mats. Total Return index by investing primarily in:
- Investment Grade Bonds: minimum 70% of net assets.
- Government Bonds: minimum 60%.
- Up to 30% in High Yield bonds or equivalent quality based on internal analysis.
Key features: Use of derivatives for risk management and portfolio optimization.
ESG: SFDR Article 8, policy integrating proprietary filters to measure the sovereign warming potential of issuers.
Quantitative Analysis:
– Over 3 years (unfavorable period):
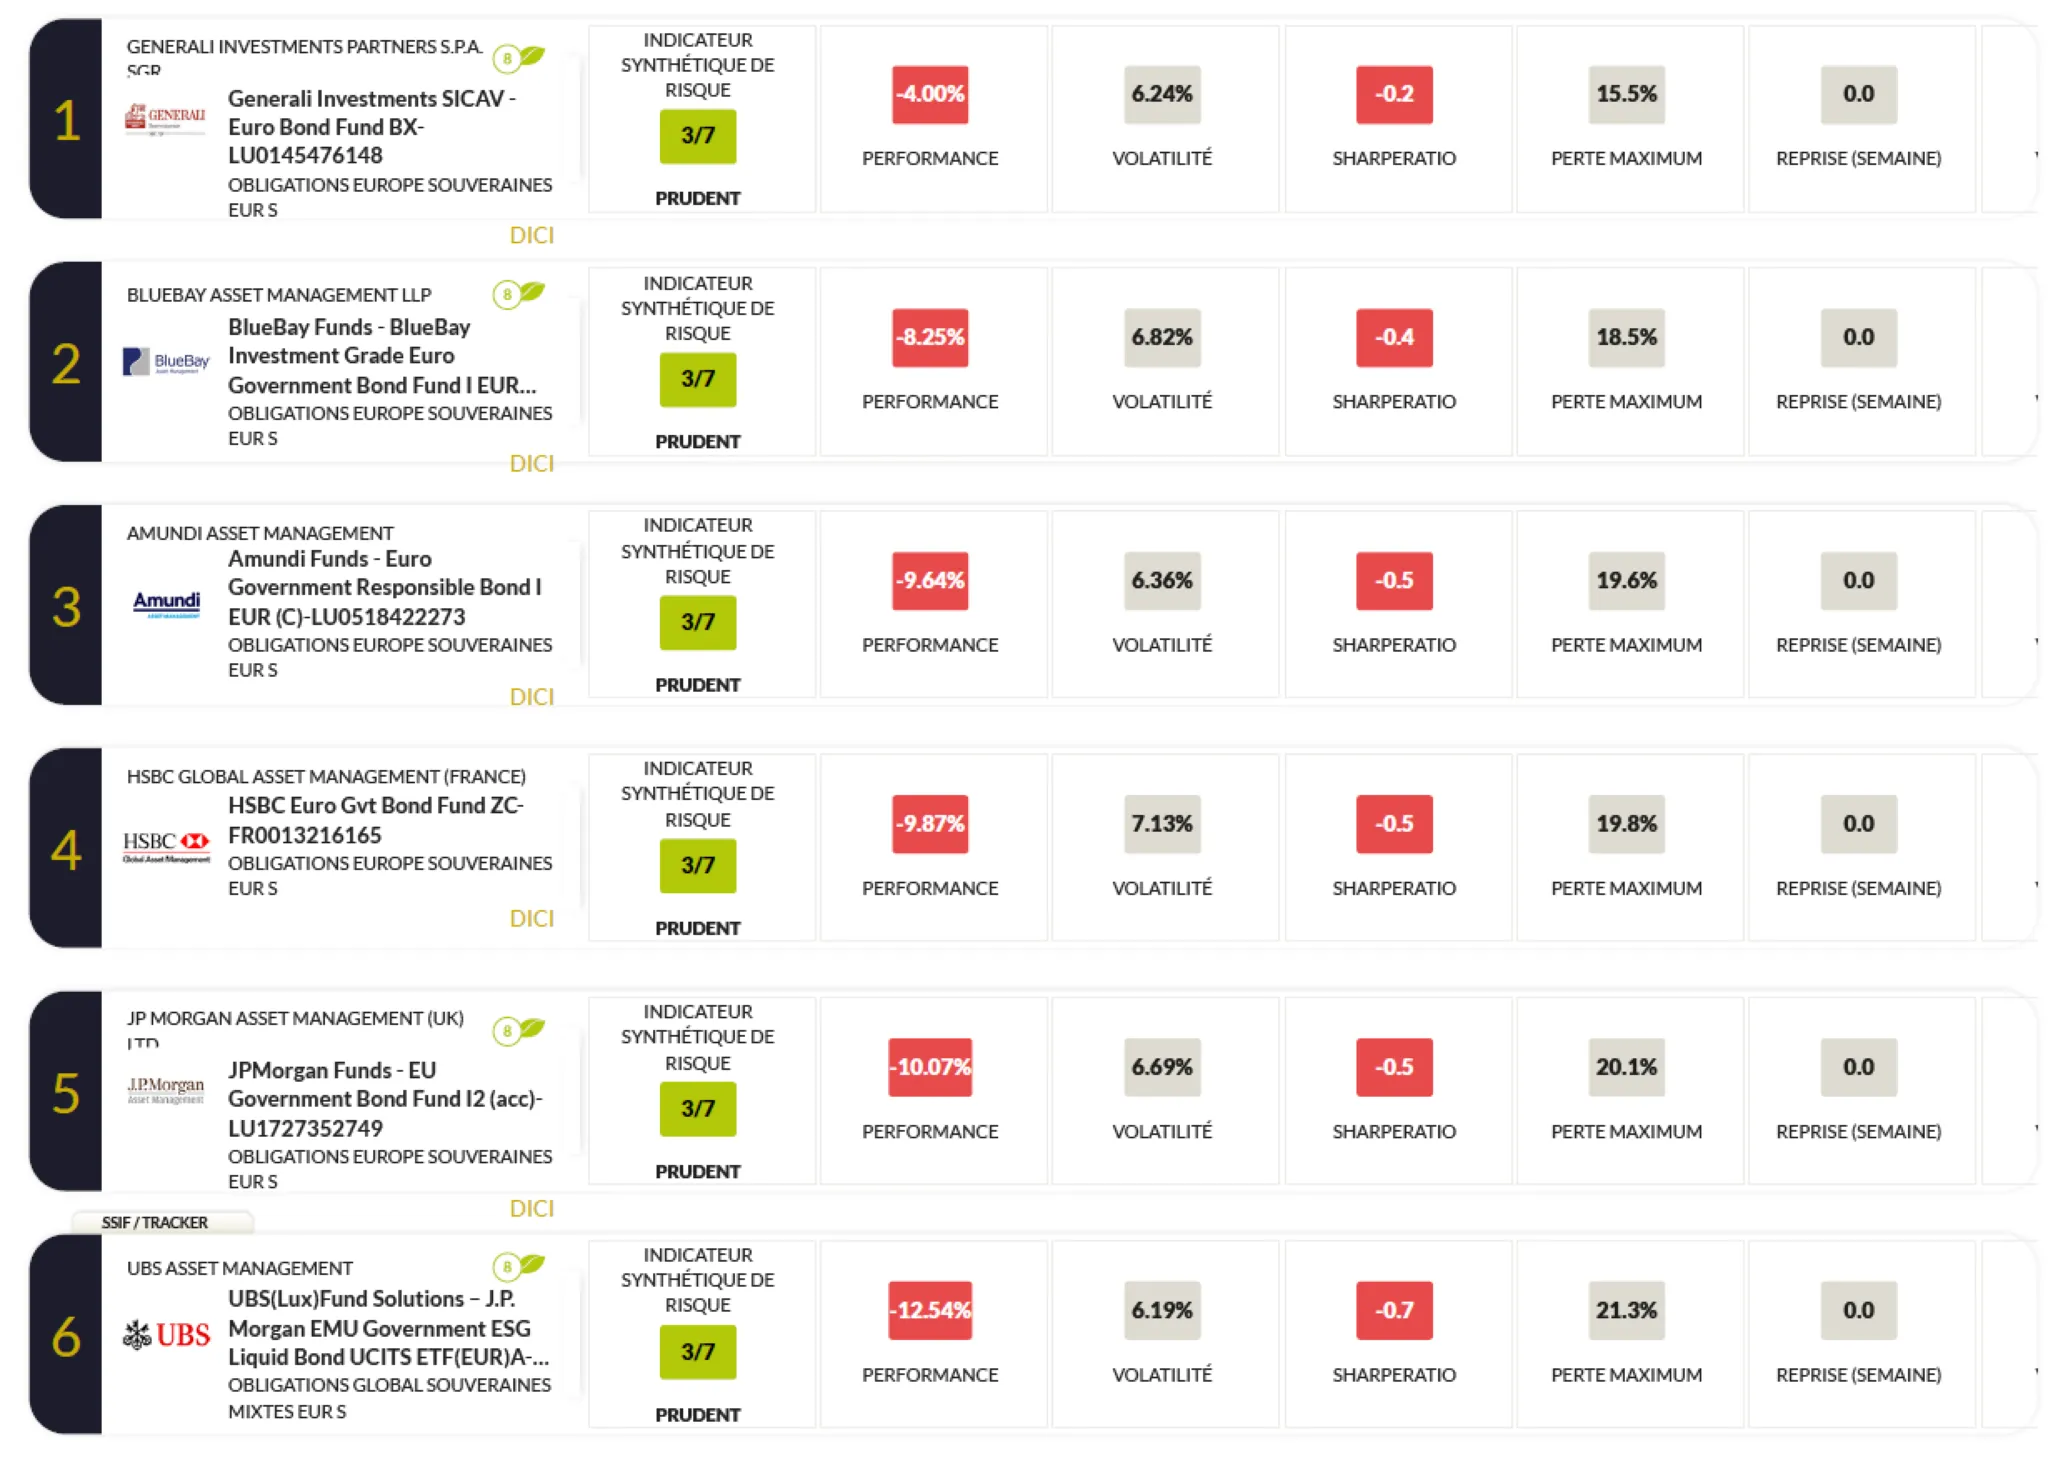
- Performance: -4.0% (-1.34% annualized), significantly less negative than the UBS tracker (-12.5%). In a difficult context, Generali demonstrates true resilience, limiting losses in a rising rate environment.
- Sharpe Ratio: -0.2, the least negative in the panel, highlighting that despite unfavorable conditions, the management limited value destruction per unit of risk.
- Maximum Drawdown: 15.5%, well below the tracker’s 21.3%, proof of better downside risk management.
3-year Conclusion: Generali confirms its ability to absorb shocks during a tense period. This indicates conservative management and robust security selection during the unfavorable rate cycle.
– Over 1 year (more favorable environment):
- Performance: +6.17%, the best in the panel, significantly exceeding the tracker (+4.36%). The fund fully benefits from the trend reversal and falling rates, showing it is not only defensive but also responsive when tailwinds appear.
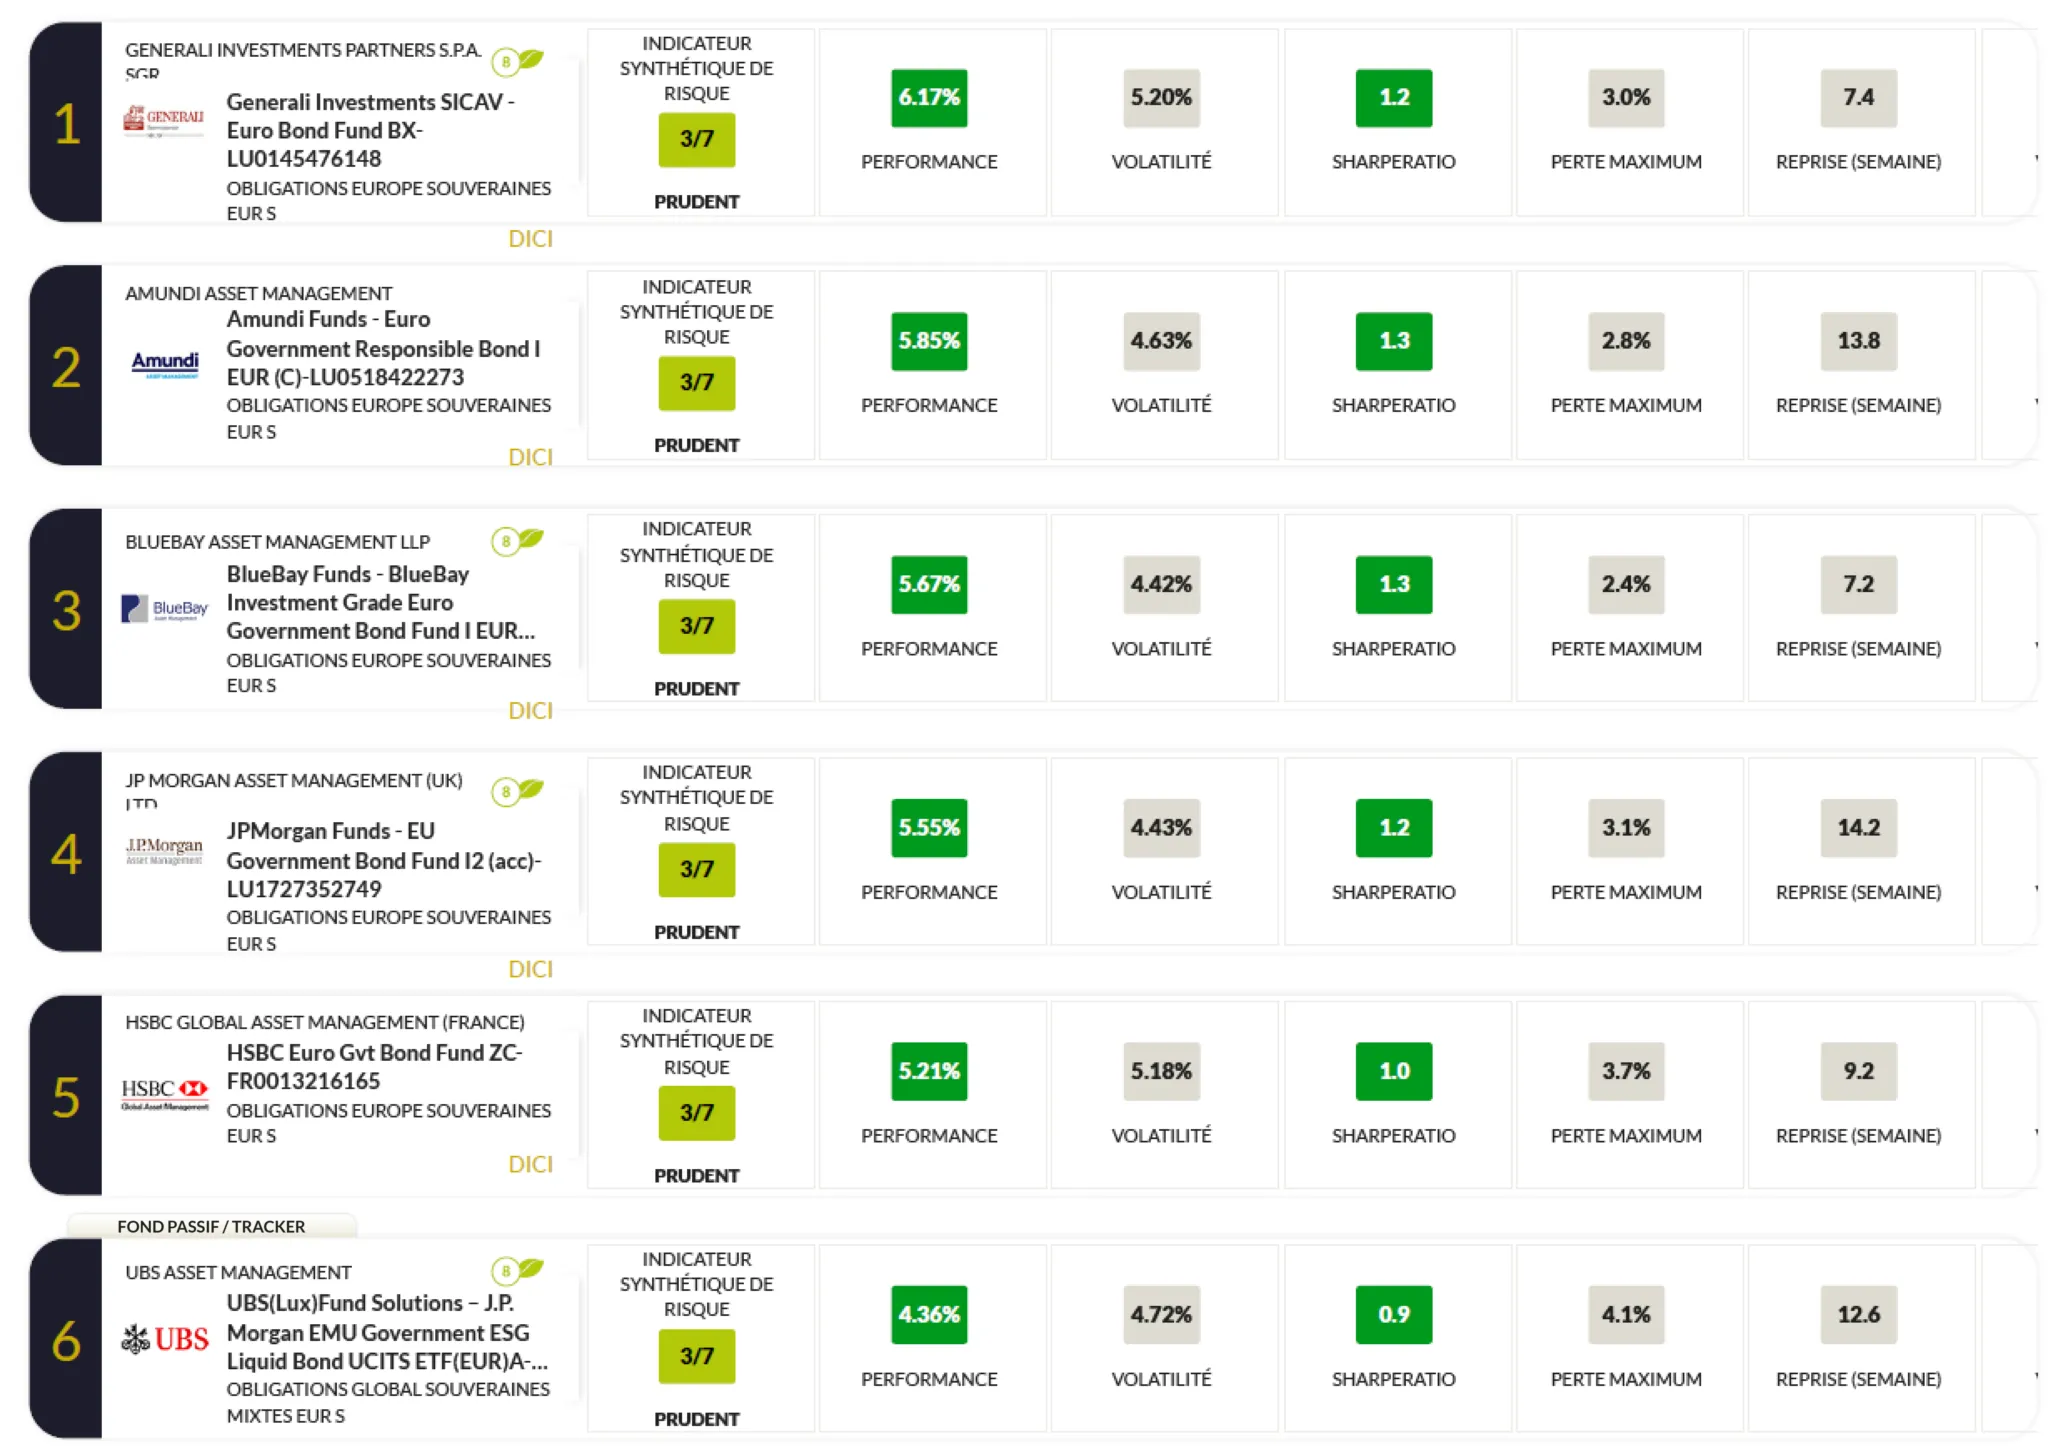
- Sharpe Ratio: 1.2, significantly higher than the tracker’s (approximately 0.9), reflecting the ability to generate attractive returns with a moderate risk level.
- Maximum Drawdown: 2.9%, contained, reinforcing the idea of good risk control.
Link between 3 years and 1 year: Generali first demonstrated great resistance in an unfavorable context, then proved particularly responsive to rate easing. This continuity in management quality, regardless of market conditions, makes Generali a solid long-term fund.
Management Company: Generali Investments Luxembourg S.A.
Managers: Mauro Valle
Commercial Contact: Gabriele ALBERICI
2.BlueBay Investment Grade Euro Government Bond Fund – I EUR
Fund Inception Date: December 22, 2010.
Investment strategy: The fund seeks to outperform the Bloomberg Euro Aggregate Treasury Index by investing in:
- Investment Grade Bonds
- Up to 15% in High Yield bonds (minimum rating B-/B3).
Key features:
- SFDR Classification: Article 8.
- Use of derivative products for active management.
ESG: Article 8 – policy with integrated ESG criteria and specific exclusions.
Quantitative Analysis:
– Over 3 years (unfavorable period):
- Performance: -8.25%, better than the tracker’s -12.5% but less favorable than Generali. The fund managed to resist better than the tracker, demonstrating a certain defensive quality, even if less pronounced than Generali.
- Sharpe Ratio: -0.4, higher than the tracker (-0.5), showing a relative ability to limit the deterioration of the return/risk ratio.
- Maximum Drawdown: 18.5%, lower than the tracker, indicating better downside risk control, but more vulnerable than Generali.
3-year Conclusion: BlueBay positions itself between the tracker and the best defensive fund (Generali). It already demonstrates superior expertise compared to the passive approach, without being the most resilient.
– Over 1 year (more favorable environment):
- Performance: +5.67%, significantly above the tracker. The fund appears to seize the opportunity of rate easing to return to marked positive performance.
- Sharpe Ratio: 1.3, one of the best over 1 year, signifying very effective management in a more clement context.
- Limited volatility and drawdown reinforce this impression of good adaptation.
Link between 3 years and 1 year: BlueBay was already a more convincing option than the tracker during unfavorable periods, even if less solid than Generali. With falling rates, BlueBay demonstrates real expertise in capitalizing on the new momentum, significantly improving its return/risk ratio. The fund thus shows it is not only defensive but can also perform during recovery phases.
Management Company: RBC BlueBay Asset Management
3.Amundi Funds Euro Government Bond – I EUR
Fund Inception Date: July 1, 2010.
Investment strategy: The objective is to outperform the JP Morgan EMU Government Bond Investment Grade index by investing in:
- Bonds issued or guaranteed by eurozone states.
- Derivatives used for hedging or risk exposure.
Key features:
- SFDR Classification: Article 8.
- Strong ESG integration in analysis and security selection.
ESG: Article 8 – portfolio partially consisting of green, social or sustainable bonds.
Quantitative Analysis:
– Over 3 years (unfavorable period):
- Performance: -9.64%, better than the tracker, but Sharpe ratio (-0.5) remains similar to the tracker. The fund preserves slightly more capital but fails to improve the return per unit of risk over this period.
- Maximum Drawdown: 19.6%, more contained than the tracker, but not as robust as Generali.
3-year Conclusion: Amundi shows a certain resistance, better than the passive approach, but does not appear as a leader during unfavorable phases. It protects better but without significantly improving the return/risk ratio.
– Over 1 year (more favorable environment):
- Performance: +5.85%, one of the best, significantly surpassing the tracker.
- Sharpe Ratio: 1.3, very high, indicating the fund knows how to optimize returns without disproportionately increasing risk.
- The moderate drawdown confirms management quality during this phase.
Link between 3 years and 1 year: Amundi goes from a “relatively good” status during unfavorable periods (without being exceptional) to a leading position when conditions soften. The fund thus demonstrates its ability not only to preserve capital in adverse markets but also to fully seize opportunities offered by falling rates.
Management Company: Amundi Luxembourg S.A.
Managers: Isabelle Vic-Philippe.
Commercial Contact: Claude Guillermas
4. JPMorgan Funds EU Government Bond Fund – I2
Fund Inception Date: December 18, 2017.
Investment strategy: The fund invests in EU government bonds to replicate the JP Morgan EMU Government Investment Grade Bond Index.
Key features
- SFDR Classification: Article 8.
- ESG integration in a large part of investment decisions.
ESG: Article 8, Allocation with a minimum of assets in sustainable investments.
Quantitative Analysis:
– Over 3 years (unfavorable period):
- Performance: -10.07%, better than the tracker, but the advantage remains slim. The Sharpe ratio (-0.5) remains similar to the tracker’s, indicating a risk-adjusted performance that is not very differentiated.
- Maximum Drawdown: 20.1%, close to the tracker, denoting limited resilience in a tense environment.
3-year Conclusion: JPMorgan was unable to clearly differentiate itself from the tracker during adverse periods. A slight improvement in gross performance, but without a real improvement in the return/risk ratio.
– Over 1 year (more favorable environment):
- Performance: +5.55%, this time significantly above the tracker.
- Sharpe Ratio: 1.2, versus approximately 0.9 for the tracker, demonstrating much better exploitation of more clement conditions.
- The drawdown remains well controlled.
Link between 3 years and 1 year: JPMorgan illustrates management that, without being particularly resistant in unfavorable markets, knows how to recover when rates ease. The fund moves from a “neutral” position relative to the tracker to notable outperformance in favorable conditions.
Management Company: J.P. Morgan Asset Management
Managers: Iain Stealey, Seamus Mac Gorain, Nicholas Wall.
Commercial Contact: Louis-Charles Nerot
5. HSBC Euro Government Bond Fund – ZC
Investment strategy: The fund aims to outperform the FTSE EMU Government Bond Index over a recommended duration of 3 years. Investments primarily in bonds issued or guaranteed by eurozone member states. May also include bonds from supranational issuers, limited to 20% of net assets. Securities must be rated Investment Grade (minimum BBB- according to Standard & Poor’s or equivalent).
Key features: Active management with monitoring of risks relative to the benchmark index.
Quantitative Analysis:
– Over 3 years (unfavorable period):
- Performance: -9.87%, better than the tracker but more negative than Generali and BlueBay. The fund limits losses but not enough to achieve a Sharpe ratio significantly better than the tracker’s (-0.5).
- Maximum Drawdown of 19.8%, slightly less than the tracker, reflects a certain resistance, but not exceptional.
3-year Conclusion: HSBC does better than the passive approach but does not stand out as a champion of resistance. The fund endured the difficult period without providing a decisive advantage over the tracker in terms of Sharpe ratio.
– Over 1 year (more favorable environment):
- Performance: +5.21%, higher than the tracker. The fund benefits from the calmer context to generate additional performance.
- Sharpe Ratio: 1.2, higher than the tracker, showing a good reaction to favorable conditions.
- The 1-year drawdown remains contained.
Link between 3 years and 1 year: After an unfavorable phase where HSBC did not particularly shine against its top peers, the fund shows an ability to capture the rebound. It thus proves a significant improvement in its return/risk when conditions ease, even if it was not the most resilient beforehand.
ESG: No information
Management Company: HSBC Global Asset Management (France)
6. UBS (Lux) Fund Solutions – J.P. Morgan EMU Government ESG Liquid Bond UCITS ETF
Fund Inception Date: September 1, 2020.
Investment strategy: ETF replicating the J.P. Morgan EMU Government ESG Liquid Bond index with the exclusion of poorly ESG-rated countries.
ESG: Article 8.
Quantitative Analysis:
- Over 3 years (unfavorable period): The tracker suffers market conditions without flexibility, posting -12.5% and the worst drawdown (21.3%). Its Sharpe ratio remains negative and as poor as the least performing funds. It lacks resilience in this environment.
- Over 1 year (more favorable environment): The tracker recovers (+4.36%) but less than the active funds, and its Sharpe ratio remains lower than all others. It does not fully exploit the improvement in market conditions.
Tracker Conclusion: The lack of flexibility and tactical adjustment penalizes it over 3 years, and over 1 year, it is unable to compete with the funds’ ability to seek additional performance and improve their return/risk.
Management Company: UBS Asset Management (Europe) S.A.
Risk indicators (EUR shares):
Top 5 active funds compared to UBS(Lux) Fund Solutions–J.P. Morgan Tracker (3 years: 07/12/2021 to 06/12/2024)
Risk indicators (EUR shares):
Top 5 active funds compared to UBS(Lux) Fund Solutions–J.P. Morgan Tracker (1 year: 07/12/2023 to 06/12/2024)
Conclusion
The cross-analysis over two market horizons — one unfavorable, marked by rising rates, and the other more favorable, characterized by a progressive easing of monetary policies — allows us to distinguish the true added value of active management versus a European sovereign bond tracker. The funds presented have been able, to varying degrees, to limit losses and contain volatility during difficult times, then effectively capitalize on falling rates and receding inflation, thus offering their investors a more robust and better-adapted source of returns.
The examples of Generali, BlueBay, Amundi, JPMorgan and HSBC illustrate the ability of active management champions to modulate their exposure, judiciously select their securities and adjust their allocations according to the economic cycle. The UBS passive tracker, confined to mechanically following an index, fell behind during the unfavorable phase and proved less responsive when conditions improved. However, it should be noted that passive funds beat 80% of active funds after fees. It is therefore important to have a powerful tool capable of selecting the best funds without passive or active bias.
In a complex universe where opportunities and risks combine, using a platform such as EnvestBoard allows you to sort through over 1,200 funds, including 180 easily accessible through life insurance or PER. This approach helps identify solutions offering the most interesting combination of structural solidity, cyclical responsiveness and ESG commitment. For investors, the challenge is to select a fund capable not only of absorbing shocks during troubled times but also of fully participating in recovery phases, in order to build a more robust and diversified portfolio.
EnvestBoard Rating – 3-year Outperformance
Each month, funds within the same category are rated based on their 3-year outperformance relative to the category average.
- 5 stars : Top 10% of the best performing funds.
- 4 stars : Next 22.5%.
- 3 stars : Next 35%.
- 2 stars : Next 22.5%.
- 1 star : Bottom 10% of the least performing funds.
Glossary
Sovereign Bond: Debt security issued by a state to finance its expenditures. It is a loan taken out by the state from investors, offering an interest rate and repayment of capital at maturity.
Investment Grade (IG): Credit quality category assigned to bonds considered relatively safe by rating agencies. They present a low default risk. IG ratings generally start at BBB- (Standard & Poor’s) or Baa3 (Moody’s) and extend up to the highest rating (AAA or Aaa).
High Yield (HY): Bonds presenting a higher default risk than Investment Grade, but generally offering a higher interest rate. They are rated below BBB- (S&P) or Baa3 (Moody’s).
Benchmark Index: An indicator, such as a bond index, used to evaluate a fund’s performance. It allows comparing the fund’s evolution to a market standard.
Sharpe Ratio: Measure of the risk-adjusted performance of an asset or portfolio. It compares the excess return obtained (relative to a risk-free rate) to the volatility (risk) incurred. A high Sharpe ratio indicates better risk/return efficiency.
Volatility: Measure of the price fluctuation of an asset or portfolio. High volatility means prices vary significantly over a given period, implying higher risk.
Drawdown (Maximum Loss): The largest decline suffered by a portfolio from its historical peak. This indicates the extent of the maximum loss incurred during a given period.
SFDR (Sustainable Finance Disclosure Regulation): European regulation aimed at improving sustainability transparency in the financial services sector.
- Article 8: Funds promoting environmental and/or social characteristics, without necessarily having a specific sustainable objective.
ESG (Environmental, Social, Governance): Extra-financial criteria used to evaluate the responsible conduct of a company, state or issuer. ESG integration consists of taking these criteria into account in the analysis and selection of securities.
Spread: Yield differential between two bond securities, often a reference sovereign bond (e.g., German) and another issuer (e.g., French OATs). A widening of spreads indicates that the borrower is considered riskier by the market, thus offering a higher yield.
“Fly to quality”: Movement of investors towards assets considered less risky (for example, bonds from strong states like Germany) during periods of financial uncertainty. This helps protect capital by investing in issuers reputed to be solid and stable.
ETF (Exchange-Traded Fund): A fund traded on the stock exchange that replicates the performance of an index, a basket of assets or a strategy. It generally offers high diversification and liquidity, often at lower cost.
Passive asset (Tracker): A fund that replicates a benchmark index without seeking to outperform it. Its management aims to faithfully reproduce the composition and performance of the tracked index, unlike active management which seeks to beat the index.
About the author: Yufeng Xie
Yufeng Xie is the CEO and co-founder of EnvestBoard, an innovative investment decision-support platform. A graduate of ENSAE Paris (Institut Polytechnique de Paris) with a background in economics from the Sorbonne, he has nearly 20 years of experience in asset and wealth management. Yufeng has held prestigious positions as a product structuring researcher, algorithmic trader and fund manager at major European financial institutions.
Passionate about economic analysis, mathematics and artificial intelligence, he founded EnvestBoard to offer advanced analytical solutions, enabling investors to make optimized and informed portfolio allocation decisions.
Please note:
Past performance is not indicative of future results. The content above does not constitute investment advice. It is an objective analysis of financial information.
Past performance is not indicative of future results. Fees are included in the performance figures. The content above does not constitute investment advice. It is an objective analysis of financial information.