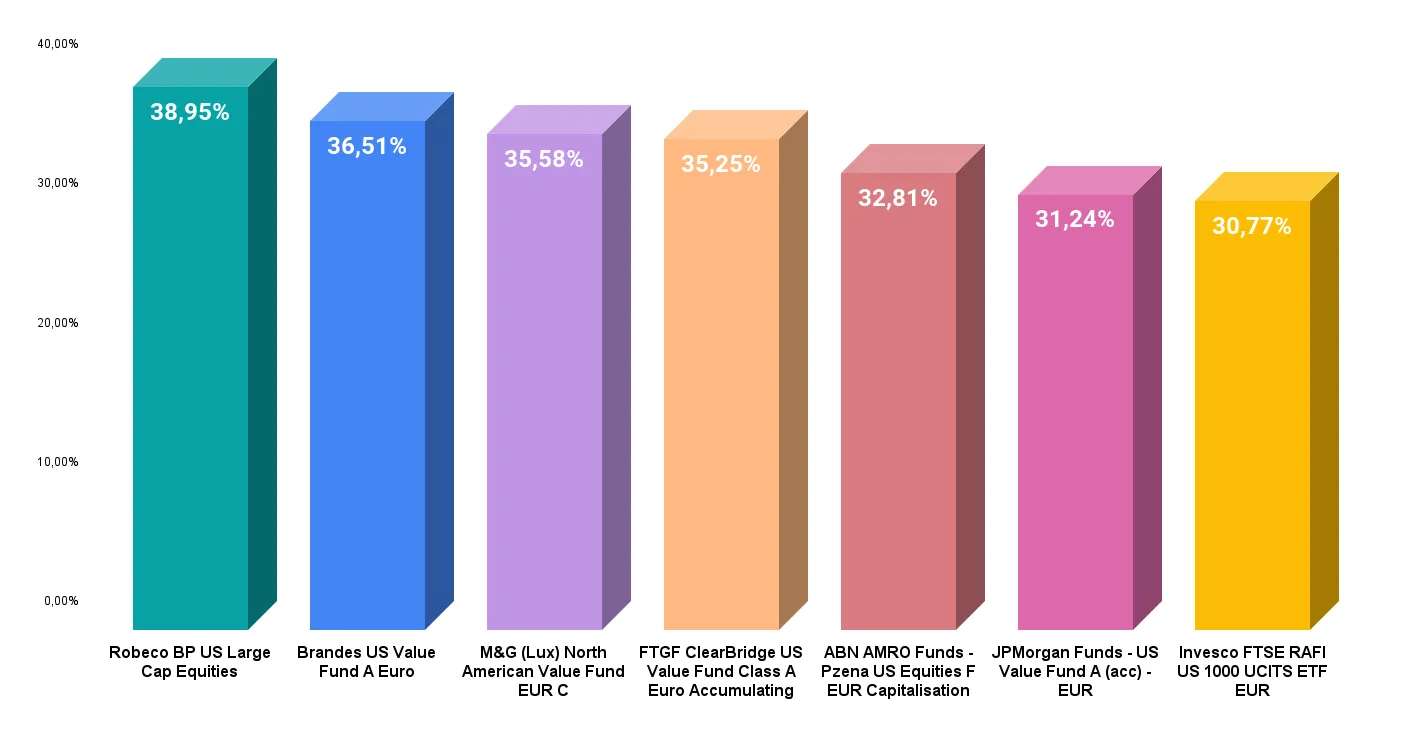
Top active US value equity funds over 3 years
Introduction
In a post-election economic context likely favorable to US Value Equities, we have identified six hidden gem funds that outperform US Value Equity trackers. These funds stand out not only for their performance, but also for their rigorous management and integration of ESG criteria. Thanks to EnvestBoard, which references more than 200,000 funds covering 97% of European offerings and 2,500 life insurance, PER, and PEA contracts, these exceptional funds have been identified. They are accessible through various investment vehicles such as life insurance contracts and PER. Discover their management, strategies, and the profiles of the managers who run them.
Performance over 3 years (from 16.11.2021 to 15.11.2024)
Funds in Detail
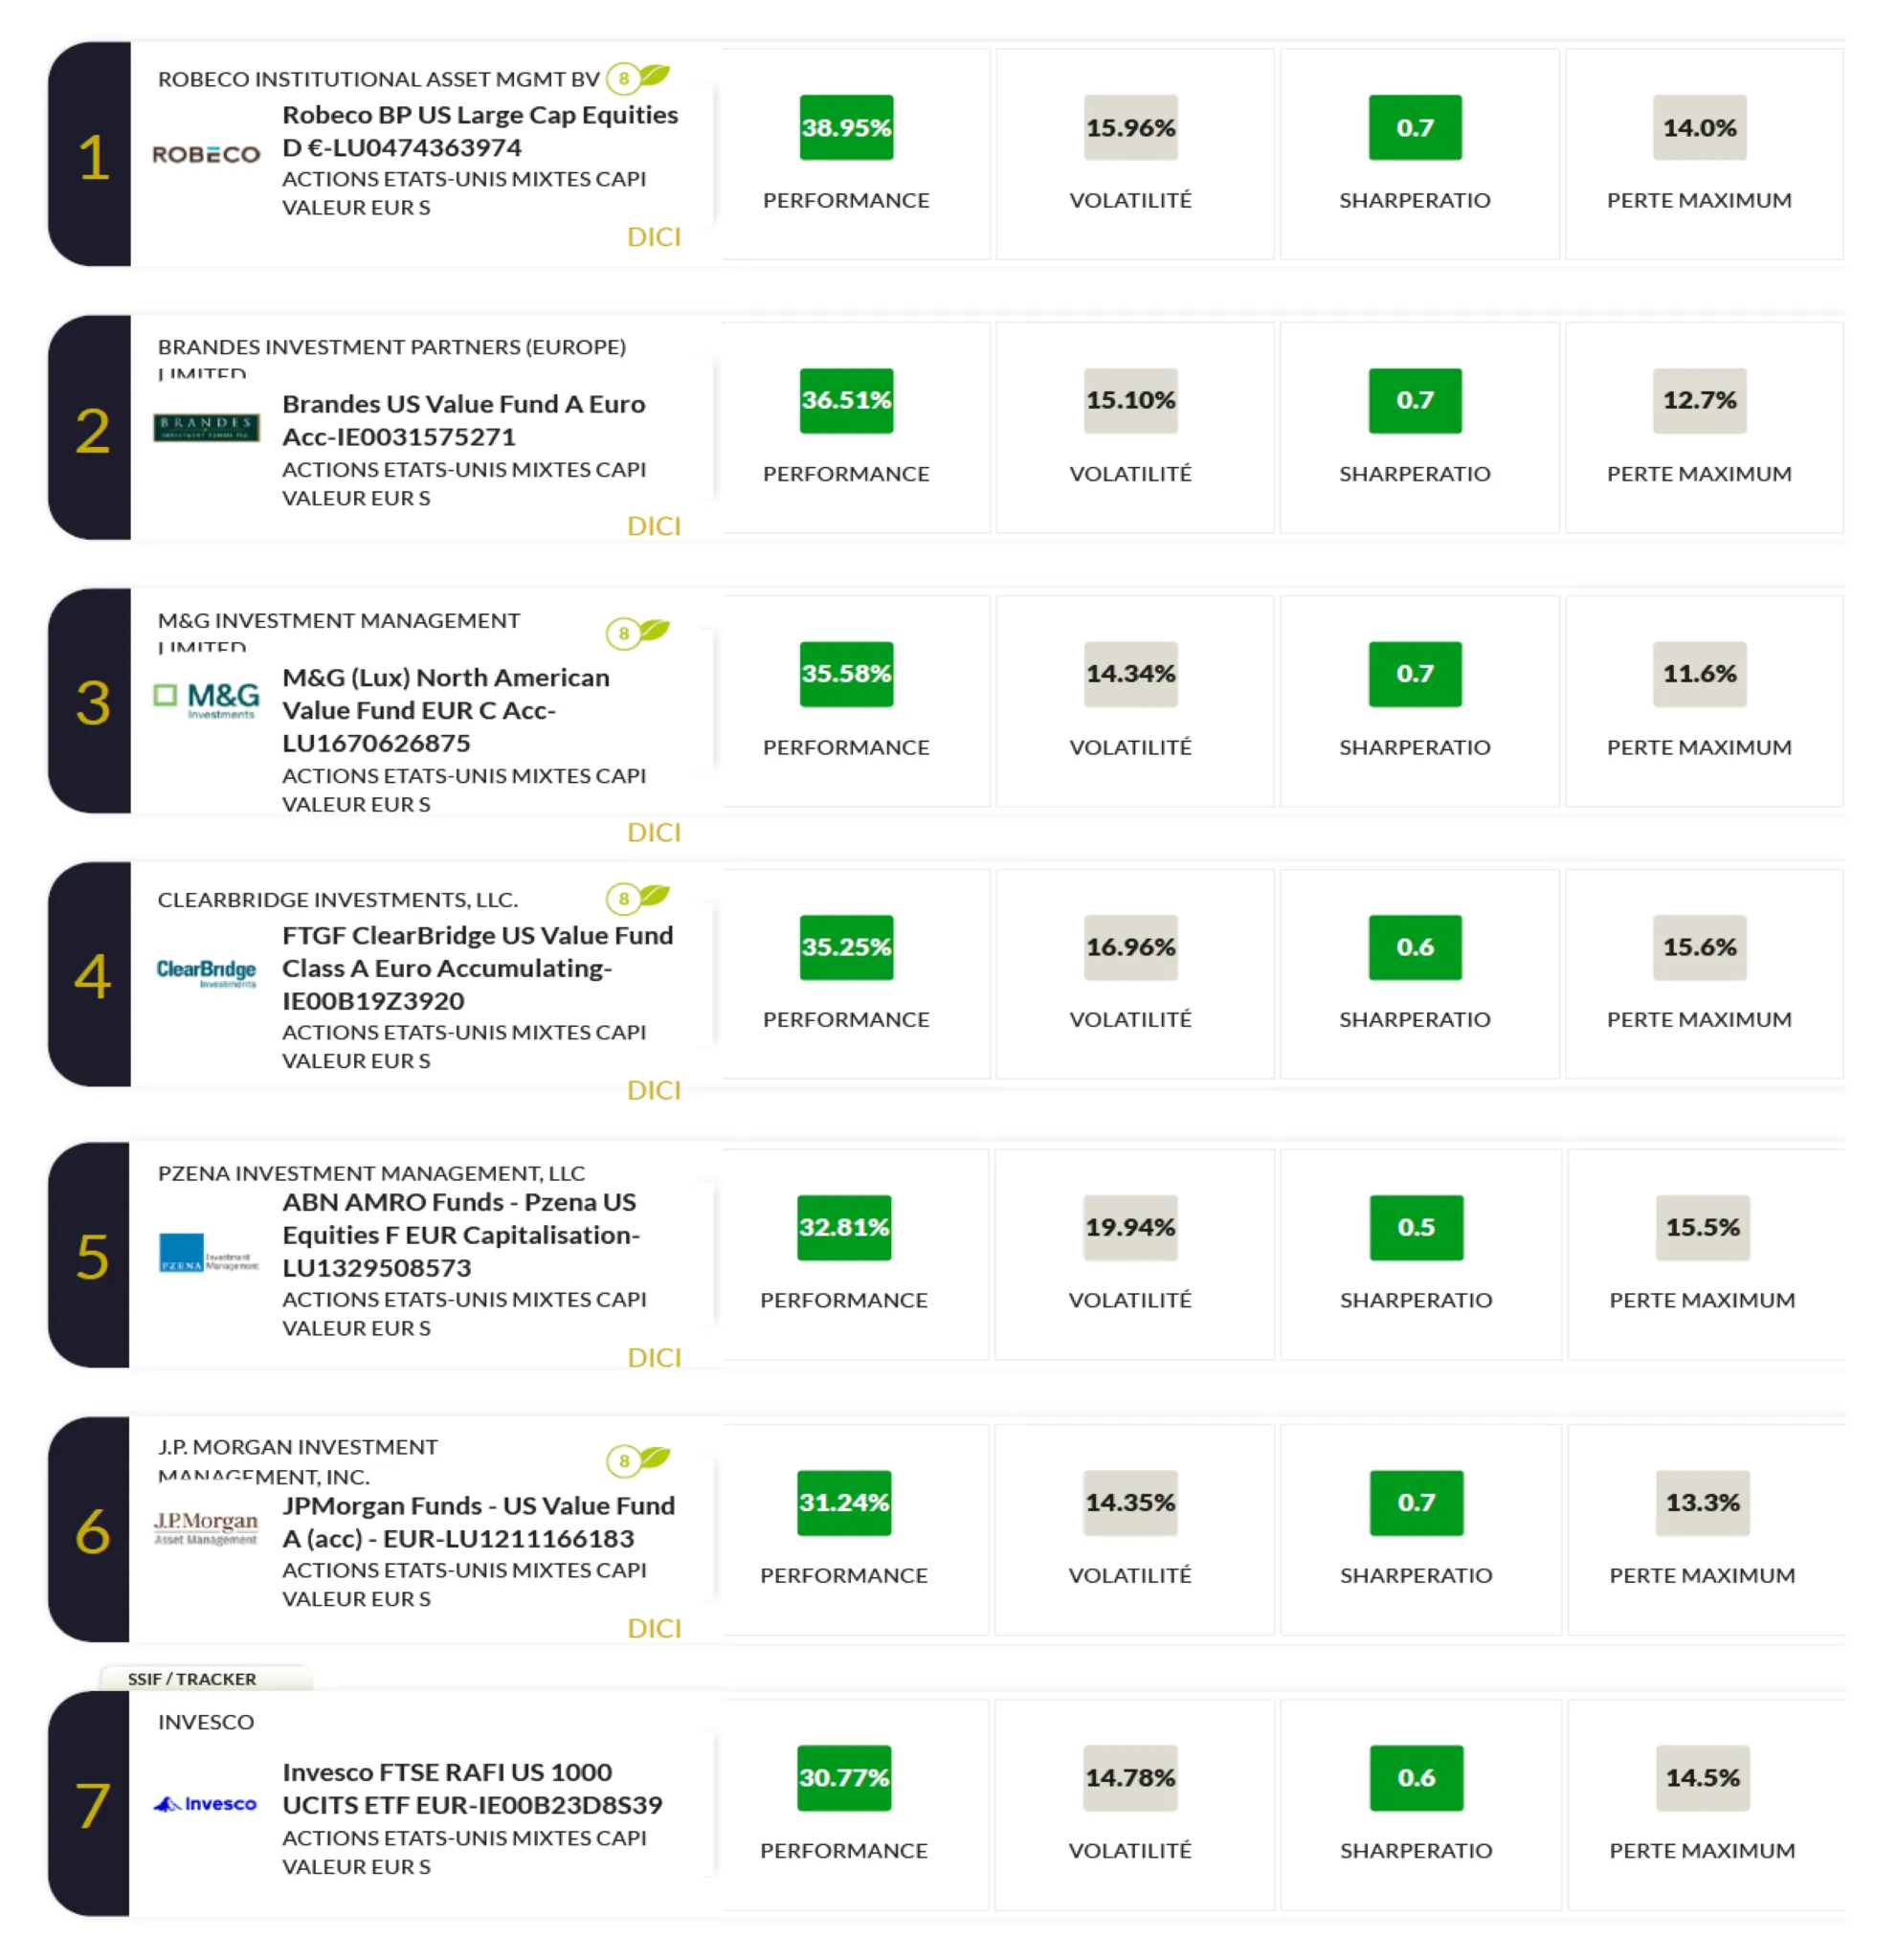
1. Robeco BP US Large Cap Equities D EUR (ISIN : LU0474363974)
- Investment strategy: Actively invests in US large-cap equities following a strict and disciplined Value approach. The process relies on rigorous fundamental analysis to identify undervalued stocks.
- Key features: Integrates ESG criteria in compliance with SFDR Article 8. The fund favors sustainable companies and applies a selection independent of its benchmark index.
- Performance indicators: The fund shows a 3-year performance of approximately 39%, outperforming trackers by an average of 9%.
- Management advantages: Excellent risk management with contained volatility and a strong focus on ESG principles, SFDR Article 8.
- Managers Robeco :
- Mark E. Donovan : Co-manager of the fund since May 27, 2010.
- David J. Pyle : Co-manager of the fund since May 28, 2010.
- Sales representative: Karim Carmoun, Mathieu Wagner
- EnvestBoard link: Access the fund
2. Brandes US Value Fund Class A Euro Shares (ISIN : IE0031575271)
- Investment strategy: This fund emphasizes a rigorous fundamental analysis approach to select undervalued US equities.
- Key features: Integrated ESG management (SFDR Article 8) and strong diversification with 35 to 85 positions.
- Performance indicators: Controlled volatility and 3-year outperformance relative to trackers.
- Management advantages: Disciplined process with a long-term orientation to capture sustainable opportunities.
- Managers Brandes :
- Jeffrey Germain : Director of Research and Portfolio Manager at Brandes Investment Partners.
- Louis Lau : Director of Research and Portfolio Manager at Brandes Investment Partners.
- EnvestBoard link: Access the fund
3. M&G (Lux) North American Value Fund (ISIN : LU1670626875)
- Investment strategy: The fund favors North American companies with solid fundamentals, selected for their long-term valuation potential.
- Key features: ESG compliance with active Value-oriented management.
- Performance indicators: High Sharpe ratio and the lowest 3-year max drawdown compared to the tracker, demonstrating excellent risk-adjusted performance.
- Management advantages: Focus on sector diversification to minimize losses and maximize risk-adjusted returns.
- Managers M&G :
- Daniel White : Portfolio Manager specializing in North American equities at M&G Investments.
- Sales representative: Kelly HEBERT, Adrien BARBANCHON
- EnvestBoard link: Access the fund
4. FTGF ClearBridge US Value Fund (ISIN : IE00B19Z3920)
- Investment strategy: This fund focuses on US companies with attractive valuations while maintaining a diversified sector approach.
- Key features: Moderate ESG management, offering a balance between resilience and growth opportunities.
- Performance indicators: Robust three-year performance with effective risk management.
- Management advantages: Balanced strategy and active management focused on sustainability.
- Managers ClearBridge :
- Sam Peters : Portfolio Manager at ClearBridge Investments.
- Jean Yu : Portfolio Manager at ClearBridge Investments.
- EnvestBoard link: Access the fund
5. ABN AMRO Funds Pzena US Equities F EUR (ISIN : LU1329508573)
- Investment strategy: Active investment in undervalued companies, primarily in US markets.
- Key features: Fundamentals-focused management with effective maximum drawdown reduction.
- Performance indicators: Among the best outperformers versus trackers, but with higher volatility.
- Management advantages: Intelligent sector diversification.
- Managers PZENA :
- John Goetz : Chief Investment Officer and Co-Portfolio Manager at Pzena Investment Management.
- Gregory Martin : Portfolio Manager at Pzena Investment Management.
- EnvestBoard link: Access the fund
6. JPMorgan Funds US Value Fund A Acc EUR (ISIN : LU1211166183)
- Investment strategy: This fund focuses on US large-cap companies following an active Value approach.
- Key features: Diversified exposure with proactive ESG management.
- Performance indicators: A robust 3-year performance of 31.24%, accompanied by a lower volatility level than trackers.
- Management advantages: Focus on the balance between performance, sustainability, and risk management.
- Managers JPMorgan :
- Clare Hart : Senior Portfolio Manager at J.P. Morgan Asset Management.
- David Silberman : Portfolio Manager at J.P. Morgan Asset Management.
- Sales representative: Louis-Charles Nerot
- EnvestBoard link: Access the fund
7. Invesco FTSE RAFI US 1000 UCITS ETF (ISIN : IE00B23D8S39)
- Investment strategy: This passive fund replicates the performance of the FTSE RAFI US 1000 Index, which represents the 1,000 largest US equities. The index is based on fundamental criteria such as book value, earnings, average revenue, and dividends over the last five years.
- Key features: The fund applies passive management with a rigorous methodology to track the index. It performs annual rebalancing and may use derivative instruments to manage risks or optimize costs.
- Management advantages:
- Reduced costs with annual management fees of 0.39%.
- Eligible for various investment accounts in France, such as life insurance contracts.
- Diversified exposure to US large-cap equities.
- Performance indicators:
- Annualized performance: In line with its benchmark index over three years, with stable cost-adjusted returns.
- Volatility: Managed consistently through faithful index replication.
- Sales representative Invesco France : Julien Valarcher
- EnvestBoard link: Access the tracker.
Risk Indicators (EUR share classes):
Top 6 active funds compared to the Invesco FTSE RAFI US 1000 tracker
Conclusion
These Active Funds stand out for their ability to generate superior performance compared to US Value Equity trackers, while maintaining rigorous risk management.
As an investor, leveraging their expertise, combined with EnvestBoard’s analytical tools, allows you to build resilient portfolios aligned with your objectives.
EnvestBoard Rating - 3-Year Outperformance
Each month, funds within the same category are rated based on their 3-year outperformance relative to the category average.
- 5 stars : Top 10% of the best-performing funds.
- 4 stars : Next 22.5%.
- 3 stars : Next 35%.
- 2 stars : Next 22.5%.
- 1 star : Bottom 10% of the least-performing funds.
Glossary
- Sharpe Ratio: An indicator measuring the risk-adjusted performance of an investment.
- Volatility: The variation in returns of a financial asset, indicating its level of risk.
- SFDR: European regulation on sustainability in the financial sector.
About the author: Yufeng Xie
Yufeng Xie is the CEO and co-founder of EnvestBoard, an innovative investment decision-support platform. A graduate of ENSAE Paris (Institut Polytechnique de Paris) and holder of an economics degree from the Sorbonne, he brings nearly 20 years of experience in asset and wealth management. Yufeng has held prestigious positions as a product structuring researcher, algorithmic trader, and fund manager at major European financial institutions.
Passionate about economic analysis, mathematics, and artificial intelligence, he founded EnvestBoard to provide advanced analytical solutions, enabling investors to make optimized and informed portfolio allocation decisions.
Please note:
Past performance is not indicative of future results. The content above does not constitute investment advice. It is an objective analysis of financial information.
Past performance is not indicative of future results. Fees are included in the performance figures. The content above does not constitute investment advice. It is an objective analysis of financial information.